Sign In

Clichés are often true and it is the case that a picture can be worth a thousand words.
Below are six graphs recording 12-month moving averages of ConstructConnect’s nonresidential construction starts.
When the value of the current month is higher than for the same month a year ago, the line will turn up; when lower, it will dip.
String a couple of similar positive or negative directional changes together over several months and one has a trend.
And that’s what the graphs are designed to do, show improving or deteriorating trends in a dozen major and more granular categories of construction work.
Click here to download the Construction Industry Snapshot Package - November 2022 PDF.
Click here for the November 2022 Industry Snapshot article, November's Nonresidential Construction Starts -36% M/M, -9% Y/Y, & +29% YTD.
Click here for the Top 10 Project Starts in the U.S. - November 2022.
Graph 1: U.S. Nonresidential Construction Starts ‒ ConstructConnect
(12-month moving averages)
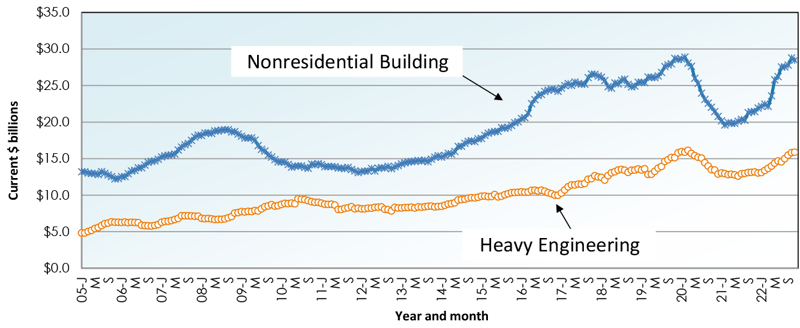
Source and Chart: ConstructConnect.
Graph 2: U.S. Commercial & Institutional Construction Starts ‒ ConstructConnect
(12-month moving averages)
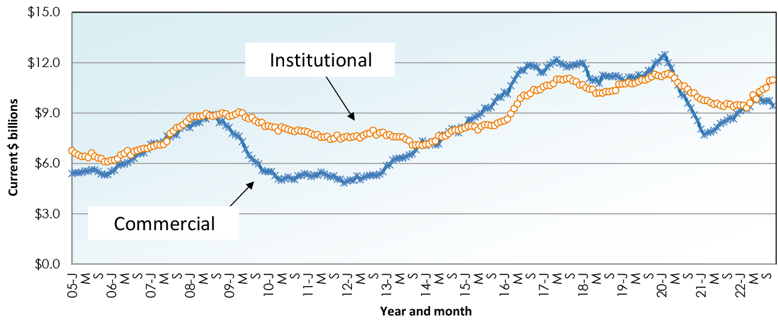
Source and Chart: ConstructConnect.
Graph 3: U.S. Retail & Private Office Building Construction Starts ‒ ConstructConnect
(12-month moving averages)
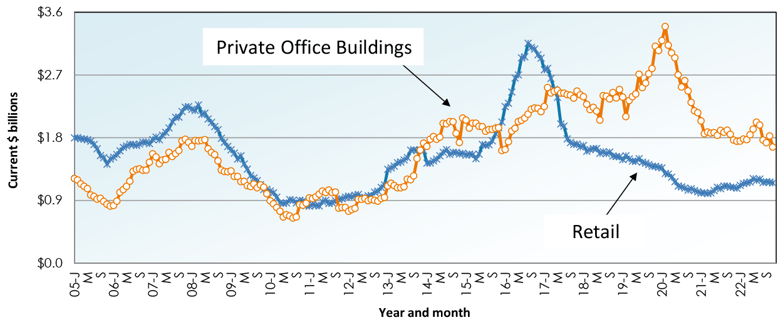
Source and Chart: ConstructConnect.
Graph 4: U.S. Hospital/Clinic & School/College Construction Starts ‒ ConstructConnect
(12-month moving averages)
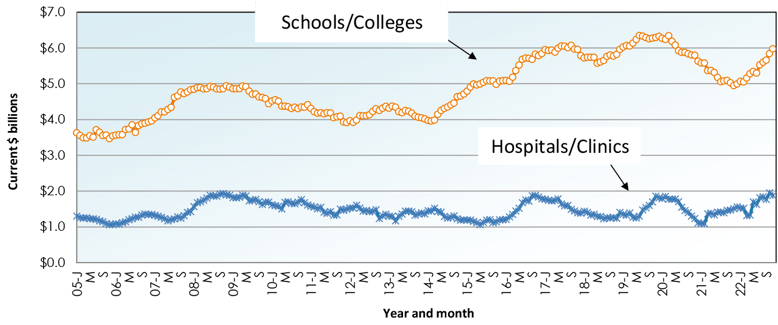
Source and Chart: ConstructConnect.
Graph 5: U.S. Road/Highway & Water/Sewage Construction Starts ‒ ConstructConnect
(12-month moving averages)
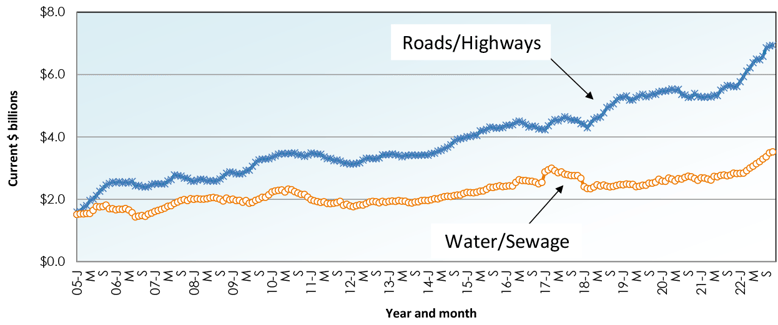
Source and Chart: ConstructConnect.
Graph 6: U.S. Bridges & Miscellaneous Civil Construction Starts ‒ ConstructConnect
(12-month moving averages)
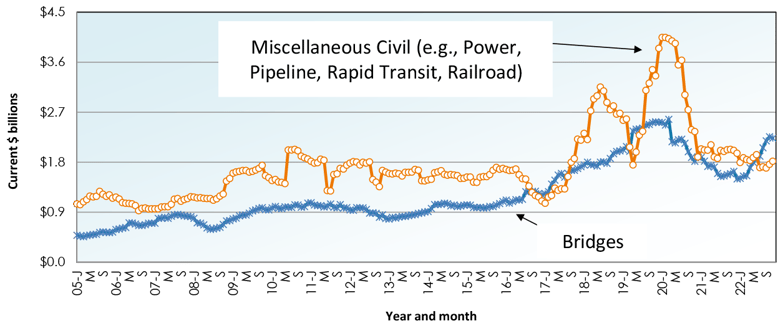
The last data points in all the graphs on this page are for July 2022.
Source and Chart: ConstructConnect.